動機
紀錄
use method
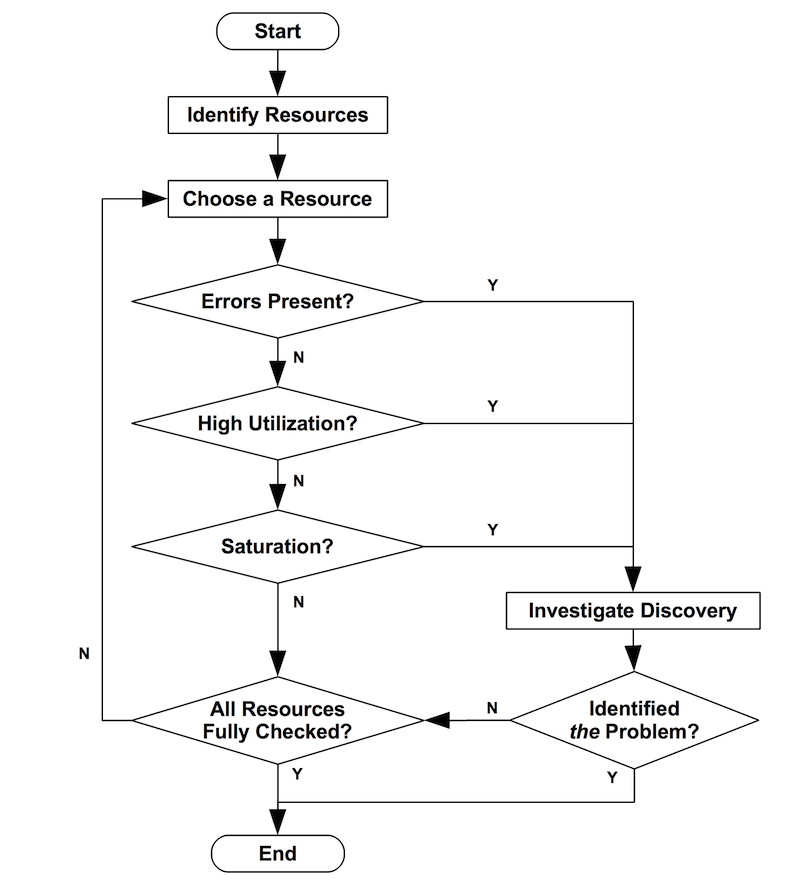
建立一個checklist去分析system的performance (bottleneck, error) checklist的項目是建立在系統resource的utilization, saturation, errors
system
系統有
- resource: 任何有限制或上限的資源
- 限制
- software: hypervisor, container
- CPU, network, mem, io
- hardware: 硬體本身的spec, network throughput
- software: hypervisor, container
- utilization: 在一段時間,有多少時間是忙的
100%: 有bottleneck,但要確認saturation與實際上的影響- 像deadlock就是整個都會停下來
>=70%- 如果單位時間太長,會讓utilization少,把小的burst藏起來
- saturation: 有多少工作是因為太忙無法處理的
- 低utilization代表沒有saturation?
- 也許長時間的utilization低,但是
- 短時間的burst,就可以讓utilization衝到100%!!
- 如果有saturation就是有事,去看在queue的waiting time或是queue length
- 低utilization代表沒有saturation?
- errors: error events!!
- 有就是出事,尤其在效能低下時
- 限制
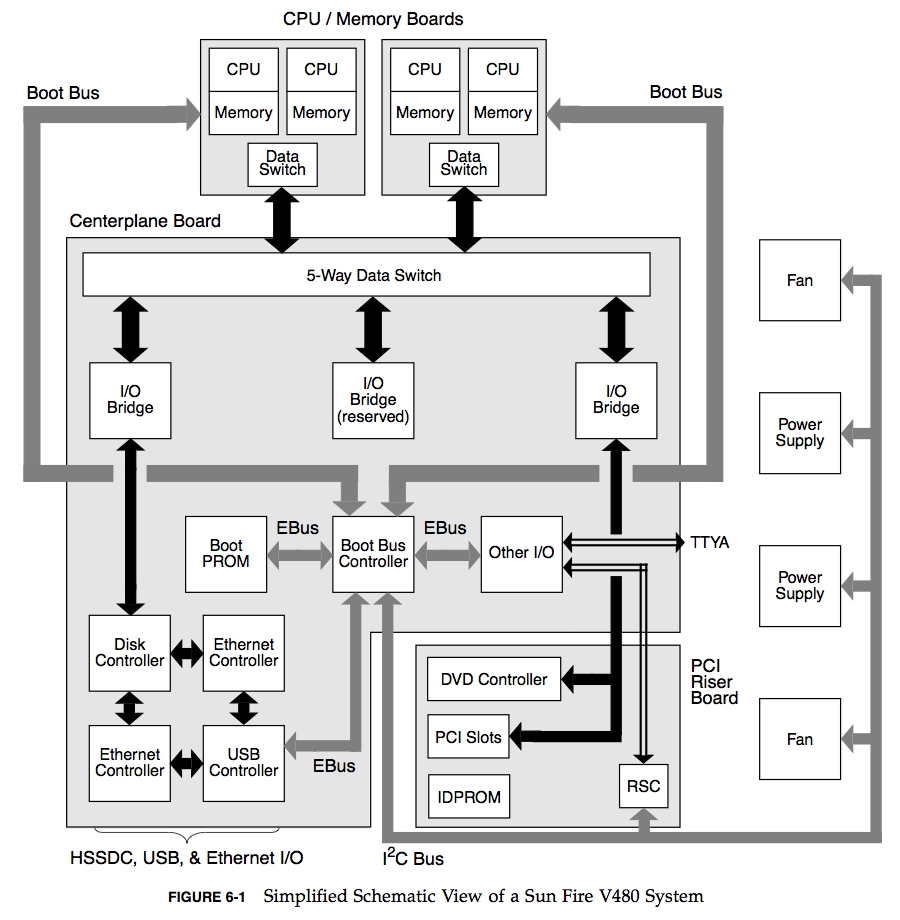
另一個是描述系統各元件溝通與連結的Functional Block Diagram
如果不懂,找個硬體工程師吧

可以在每個箭頭上標他們的bandwidth,有的時候光是這樣就會知道bottleneck在哪

有什麼資源
CPUs: sockets, cores, hardware threads (virtual CPUs)
Memory: capacity
Network interfaces
Storage devices: I/O, capacity
Controllers: storage, network cards
Interconnects: CPUs, memory, I/O
- 通常不是這裡成為bottleneck,但如果是就要考慮zero-copy之類的技術
mutex locks
- utilization: 鎖被持有多久
- saturation: 有多少process在等
thread pools
- utilization: 所有thread處理的時間
- saturation: 有多少request還沒被pool受理
process/thread/file descriptor capacity
- utilization: 有多少process被allocate (一般來說process的數量都有上限)
- saturation: 還沒被allocation process還有多少
- error: fork失敗之類的
有趣的是,cache不在裡面,因為cache是幫助system在高利用率與高飽和率時讓system變好的,所以USE method不會去看cache
USE method是看會被高utilization與高saturation搞垮的元件 在跑完USE method之後可以看其他效能指標,cache miss等等
指標
| resource | type | metric |
|---|---|---|
| CPU | utilization | CPU utilization (either per-CPU or a system-wide average) |
| CPU | saturation | run-queue length or scheduler latency(aka |
| Memory capacity | utilization | available free memory (system-wide) |
| Memory capacity | saturation | anonymous paging or thread swapping (maybe "page scanning" too) |
| Network interface | utilization | RX/TX throughput / max bandwidth |
| Storage device I/O | utilization | device busy percent |
| Storage device I/O | saturation | wait queue length |
| Storage device I/O | errors | device errors ("soft", "hard", ...) |
| resource | type | metric |
|---|---|---|
| CPU | errors | eg, correctable CPU cache ECC events or faulted CPUs (if the OS+HW supports that) |
| Memory capacity | errors | eg, failed malloc()s (although this is usually due to virtual memory exhaustion, not physical) |
| Network | saturation | saturation related NIC or OS events; eg "dropped", "overruns" |
| Storage controller | utilization | depends on the controller; it may have a max IOPS or throughput that can be checked vs current activity |
| CPU interconnect | utilization | per port throughput / max bandwidth (CPU performance counters) |
| Memory interconnect | saturation | memory stall cycles, high CPI (CPU performance counters) |
| I/O interconnect | utilization | bus throughput / max bandwidth (performance counters may exist on your HW; eg, Intel "uncore" events) |
單位都是 次數、一段時間的平均數 另外不是所有指標都可以取得,有些指標需要自己寫程式去拿
指令 (for linux)
uptime- 看
- 想用CPU的process
- 在等uninterruptible IO(disk io)的process
- 測量時間單位: 1min, 5min, 15mins
- 看
dmesg | tail- 看
- error: tcp drop, oom-kill
- 看
vmstat 1: 1秒一行r: 有多少想用CPU的processfree: free memsi, so: swap-in, swap-out (有就是實體記憶體沒了)us, sy, id, wa, st: total cpu time- user, system(kernel), idle, wait io, stolen
- 可以看出cpu忙不忙 (user+system)
- wait io可以看成idle,這可以當成idle的理由
- user, system(kernel), idle, wait io, stolen
mpstat -P ALL 1: 所有cpu,1秒一行- 與前面很像,但是可以看到每個virtual cpu的usage
- 這是有irq與sortirq,都是中斷,通常是用kernel處理的資料,像網路
pidstat 1- 很像top,但是以時間為主
- 會列出當下再跑的process以及process的cpu時間
iostat -xz 1r/s, w/s, rkB/s, wkB/s: read, write的速度await: io的時間,如果比一般情況還差就是device出事avgqu-sz: 有多少req在等,大於1就是device saturation%util: Device utilization- 有的dev是logic的,所以就算util 100%,背後的裝置也許很閒
free -m- 就是看有沒有0,有就是記憶體要用完了
sar -n DEV 1- 看network iface的throughput
sar -n TCP,ETCP 1- 看tcp connection!!
active/s: 有多少從host出去的tcppassive/s: 有多少從remote進來的tcpretrans/s: retransmits
- 看tcp connection!!
top- 再一次確認這裡看到的數字是不是與之前差不多
- top是以process去排列,這樣不好觀察pattern
- Ctrl-S to pause, Ctrl-Q to continue
tsa method
tsa處理thread的performance
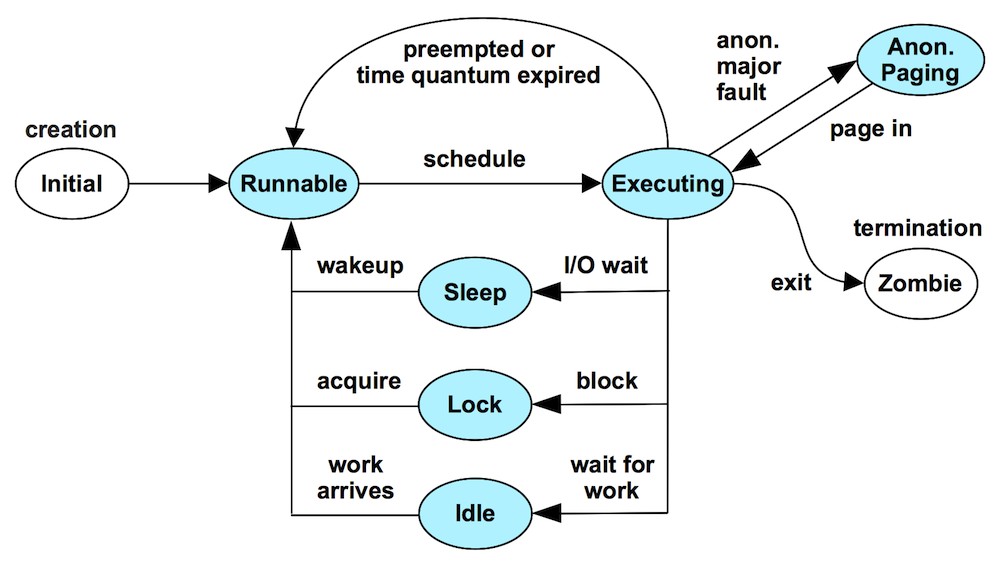
- 觀察thread在各個state所花費的時間
- 根據各個state所花費的時間去研究root cause
state
- Executing: on-CPU
- Waiting:
- Runnable: and waiting for a turn on-CPU
- user (userspace)
- kernel (kernel space)
- Anonymous Paging: (aka swapping) runnable, but blocked waiting for residency
- Sleeping: waiting for I/O, including network, block, and data/text page-ins
- 可以依據sleep的理由往下切
- storage
- network
- other
- 或是
- uninterruptibe wait
- interruptibe wait
- 可以依據sleep的理由往下切
- Lock: waiting to acquire a synchronization lock (waiting on someone else)
- Runnable: and waiting for a turn on-CPU
- Idle: waiting for work
Anonymous Paging應該往下畫

The Runnable, Anonymous Paging, Sleeping, and Lock states measure time spent waiting while performing work: a measure of latency. Tuning these latency states often provides the greatest wins, as their state time can be reduced to zero.
像是Anonymous Paging太多(應該要是趨近0才對),就去看memory
該看什麼 (怎麼與system相關)
| State | Description | Investigate |
|---|---|---|
| Executing | Running on-CPU | Split into user and system time. For user time, use CPU profilers to identify hot code paths. For system time, examine syscall rates, and profile kernel CPU time. Profiling can include Flame Graphs. Note that CPU time can include spinning on a lock. |
| Runnable | Run queue latency | Check system-wide CPU utilization and saturation, for both physical CPUs and any imposed resource controls (eg, USE Method). Check for any processor binding, which can affect CPU scheduling. |
| Anonymous Paging | Runnable, but either swapped-out or paged-out, and waiting for residency | Check system-wide main memory availability. Also check for any resource control limiting memory usage. Saturation metrics can be studied: paging and swapping (eg, following the USE Method). |
| Sleeping | Waiting for I/O, including network, block, and data/text page-ins | Check syscalls, resource usage, thread blocking. Syscalls: identify time in syscalls and identify the related resource; also check for mmap() usage and non-syscall I/O via mappings. Resource usage: eg, the USE Method to identify busy resources. Thread blocking: trace scheduler off-CPU events with user and kernel stacks to identify reason; see Off-CPU Performance Analysis. |
| Lock | Waiting to acquire a synchronization lock (waiting on someone else) | Identify the lock the thread is waiting on, and the reason it took time to acquire. Lock analysis. |
| Idle | Waiting for work | Check the client load applied. |
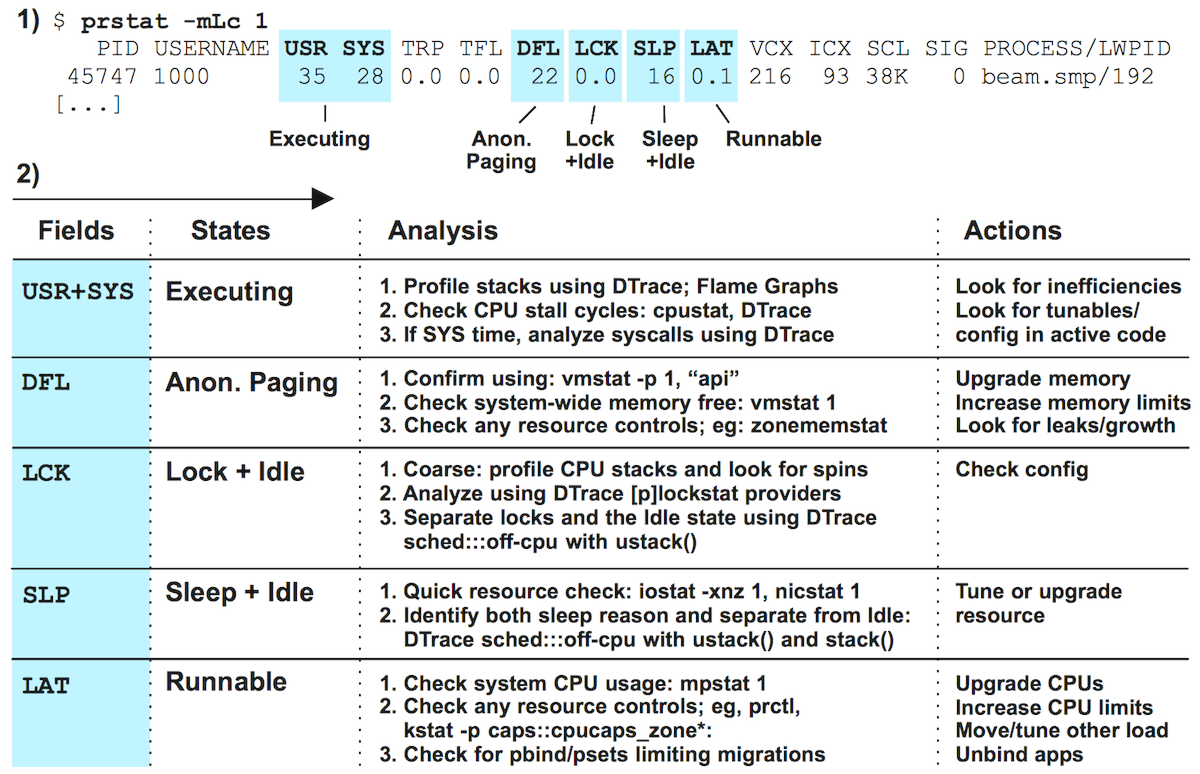
下面是Solaris的例子

Ref
The USE Method The TSA Method Linux Performance Analysis in 60,000 Milliseconds Netflix at Velocity 2015: Linux Performance Tools